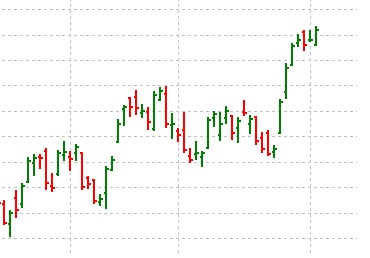
NIFTY SPOT VIEW-6TH JUNE 2016
We are around the pressure date so ,be careful.Rest of view is same.
The strength of short term trend is little weak, but it is completely uptrend, so be careful book profit on higher level. Stock like axisbank, tatamotors and yesbank are very good for trading.
So watch resistance around-8240-8274-8339 and support stand around-8134.
Short term trend will turned down below 8134 level.
Gann pressure dates for this month around-6th, 12th, 16th and 21st June 2016.
:COMMODITY UPDATE:
NATURAL GAS UPDATE (12):
Posted on 12th January 2014:
All regular website viewer already known about 25th December, I was wrote in my site, pressure date for Natural Gas and price 280.Natural Gas made short term top just before two days from the predicted date and price was (280.90). Watch 14th January very carefully for Natural Gas.
NATURAL GAS UPDATE (11):
Posted on 1st December 2013:
Natural gas given 38 points rally from the 5th November 2013 that I was written in my website as a pressure date also 10th November, If I am looking my working chart Natural gas was given little change around the 10th November.Natural Gas short term and intermediate term trend is up my trading strategy will be buy on dips.
Gann pressure date for the month of December for Natural Gas around 10th and 25th December 2013.
NATURAL GAS UPDATE (10):
Posted on 12th November 2013:
27th October I was written about pressure date of Natural gas,N.G. made low exactly on that date and given good bounce from that level.For better trading keep watching www.charttrading.in.
NATURAL GAS UPDATE (9):
Posted on 27th October 2013:
Natural gas gave respect to all Square of nine level; according to me the level 241 is the long term resistance for natural gas, if N. G.able to trade above this level then I am expecting big upside rally in Gas and the level 215 is the top most support level, if Gas break it and maintain the trade below this level then major fall expected in Gas.
5th and 10th November 2013, will work as are pressure date for Natural gas also.(10th November is Sunday then watch market action either Friday or Monday).
NATURAL GAS UPDATE (8):
posted on 25th August 2013
10th August Natural gas made a low 194.80 and my given square of nine levels was 195 and today Natural gas trading around 230 levels. Now think about power of Gann square of nine levels. Natural gas changed the short term trend form 194.80 level.
Around the weekend 14th September 2013 and 30th November 2013 are important for Natural gas.
CRUDE OIL UPDATE:
Posted on 14th July 2013
Crude oil given 796 points profit from my estimated level I think all my site viewers are now holding very good profit on Crude.
posted on 1st July 2013
Those are follow my advice they should got profit by trading Crude Oil which I was told on 18th June in my site about break out of crude.
posted on 18th June 2013:
Crude oil given a break out try to trade according to this trend for big profit.
NATURAL GAS UPDATE (7):
posted on 29th July 2013:
1st July I has been forecasted about price of Natural Gas and it is broke the 210.50 two days ago. So according to me natural Gas trend is down and we may see lower side. Those who made the short position on natural gas till hold the postion.And S D Wave trader maintain the stop loss according to weekly chart for big profit.
NATURAL GAS UPDATE (6):
Posted on 1st July
Natural gas is now trading in a range, upside range is 239.80and down side range is 210.50.So there will be no major rally until and unless broke this range successfully. It is advice to all my students’ trade accordingly.
All ultimate students are known that we are standing around very crucial time zone for Natural gas.
NATURAL GAS UPDATE (5):
Posted on 26th April 2013:
On 22nd April I was forecasted about Natural Gas price correction, now see gas trading around 225, from 238 this was the minor top of gas on Daily chart.
NATURAL GAS UPDATE (4):
Those trader holding the Natural gas long position try to liquid their position, I think Natural Gas ready for a correction around this current market price
DISCLAIMER :
www.ChartTrading.In is an educational website for traders and investors. This update is an information service only .The author shall not be liable for any loss or profit or any other commercial damages, including but not limited to special, incidental, consequential, or other damages.


